

TLDR: A quiet quarter felt like a marketing problem until we mapped two years of enquiries by month and realised the drop repeated almost exactly every year, tied to when our cross-border buyers travel and when they don't. We had been reacting to seasonality as if it were a surprise each time. A forecast chart built from our own history turned it into something we now plan spend and staffing around instead of panicking over.
The quarter looked bad on every dashboard we had. Enquiries down, viewings down, the sales team asking whether something had changed in the market or in our own marketing that explained it. We spent the first two weeks of that slow quarter treating it as an emergency, reviewing ad spend, questioning the website, second-guessing content decisions that had nothing to do with what was actually happening.
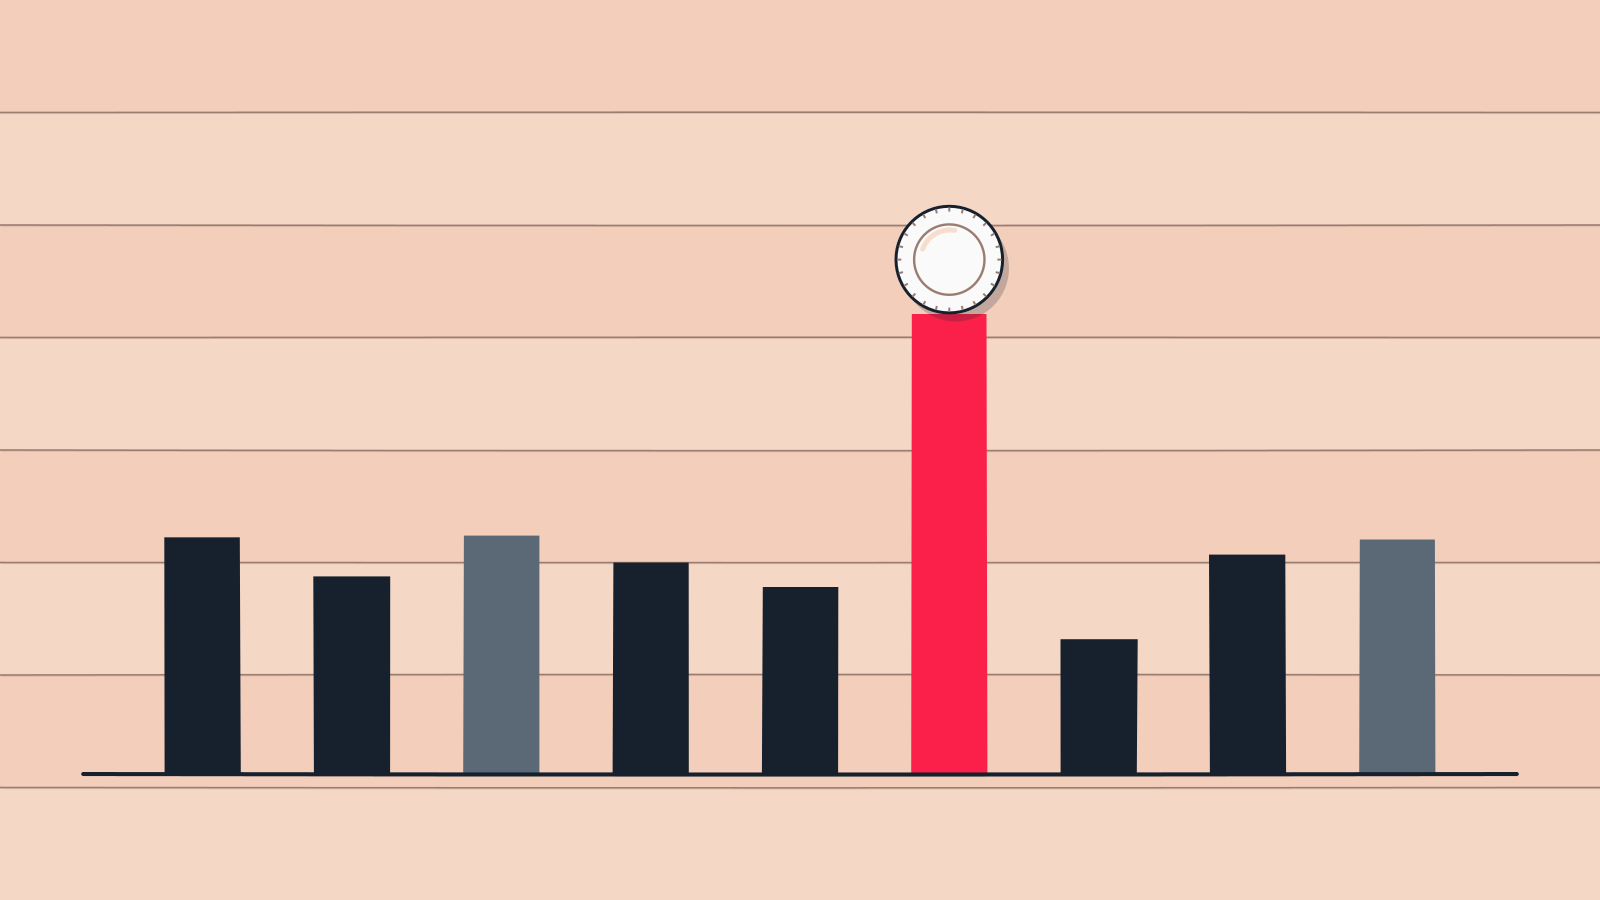
What ended the panic was pulling enquiry counts by month for the previous two years and putting them on one chart. The same quarter, the same months, had been quiet the year before, and the year before that, by almost the same proportion. We had not found a new problem. We had rediscovered an old pattern we had never bothered to write down.
Why the Pattern Had Been Invisible Until Then
Our buyers are largely cross-border, from France, Belgium, Switzerland, the Gulf and West Africa, and their availability to travel for a viewing follows their own calendars, not ours: school holidays, religious observances, and the summer stretch when a second-home search takes a back seat to the holiday itself. None of that was a secret to anyone on the team. It had simply never been turned into a number, so every time the quiet quarter arrived, it arrived as a surprise rather than as an expected event with a known size.
Corporate Finance Institute's explanation of seasonality describes exactly this trap: a business with a genuinely seasonal pattern that has never quantified it will keep mistaking a recurring, predictable dip for a new problem each time, and will keep spending emergency-level attention on something that a two-year chart would have flagged as routine.
What the Chart Actually Showed
Once built, the chart did more than confirm the dip existed. It showed the shape of the recovery too, which months the enquiry volume climbed back and by how much, and it showed that one specific month inside the slow quarter was consistently the worst of the three, not evenly distributed across the whole period the way it had felt in the moment.
- The slow stretch: a real and repeating drop, concentrated more heavily in one month than the other two, tied closely to when our core buyer markets are least likely to be planning travel.
- The recovery: sharp rather than gradual, with enquiries returning to the yearly average within a few weeks once the seasonal factor lifted, both years running.
- The one exception: a smaller dip the following year that recovered faster than the pattern predicted, which turned out to trace back to a marketing push we had run during the quiet period rather than any change in the seasonal factor itself, and which became a useful test case for what timing our efforts can and cannot fix.
Knight Frank's research on the international luxury property market documents similar travel-linked seasonality across cross-border buyer segments more broadly, which gave us some confidence that what we were seeing was a structural feature of this kind of buyer, not something specific to one bad year at our own brokerage.
What We Changed Because of It
A dip you can forecast is a planning input. A dip you cannot forecast feels, every time, like a crisis that demands an emergency response. We shifted our content and outreach calendar so that the heaviest publishing push lands just before the seasonal recovery begins, aiming to be visible right as our buyers start actively searching again rather than reacting once enquiries have already started climbing. We also stopped increasing paid spend during the quiet month itself, since the chart showed clearly that the dip was about buyer availability, not about our own visibility, and no amount of extra spend in that specific month had ever moved the needle in either of the two years we reviewed.
What to Build in Your Own Business
Pull two to three years of your own volume, by month, whatever the equivalent of "enquiries" is for your business, and look for a shape that repeats. If one exists, the quiet period stops being a mystery you re-litigate every year and becomes a known input you can plan spend, staffing and messaging around well in advance. A brokerage of any size can build this chart from data it already has, and ours now sits at the top of every quarterly planning document we open.